


Aave | AAVE
$88.99
Coin info
Rank
#47
Market Cap
$1,839,809,721
Volume (24h)
$89,960,345
Circulating Supply
15,183,429.94
Total Supply
16,000,000
Do you think the price will rise or fall?
Rise 40%
Fall 60%
About Aave
Aave is a decentralized money market protocol where users can lend and borrow cryptocurrency across 20 different assets as collateral. The protocol has a native token called AAVE, which is also a governance token that lets the community decide the direction of the protocol in a collective manner. Lenders can earn interest by providing liquidity to the market, while borrowers can borrow by collateralizing their cryptoassets to take out loans from the liquidity pools.
Price perfomance
Depth of Market
Depth +2%
Depth -2%

We recommend

Uniswap
Rank #41
$3.5
-1.65%

Curve DAO
Rank #120
$0.2104
-0.26%

Compound
Rank #198
$17.06
-1.75%

1INCH
Rank #222
$0.07336
+0.32%

Synthetix
Rank #261
$0.2750
+8.81%

yearn.finance
Rank #289
$2,138.28
-0.21%

Kava
Rank #402
$0.04512
+0.74%

Sushi
Rank #422
$0.1720
+4.42%

Bancor Network
Rank #611
$0.2745
+0.54%

Balancer
Rank #1221
$0.5824
+74.28%

Aavegotchi ALPHA
Rank #15360
$0.0001550
+0%

Maker
Rank #30942
$1,420.31
+0.22%
News
See more9 Jun 2026, 13:16
CoinDesk 20 performance update: AAVE Drops 2.6% as all constituents trade lower
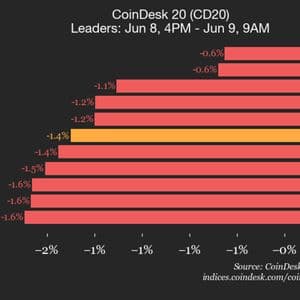
Uniswap (UNI), down 2.9% from Monday, joined Aave (AAVE) as an underperformer.
8 Jun 2026, 18:25
Aave faces $8.45 billion outflow after $292 million hack

🚨 $8.45 billion exited from Aave within 48 hours after a $292 million KelpDAO hack. 💸 Emergency support of 30,000 ETH helped stabilize $AAVE during the crisis. 🔍 Attackers used infrastructure vulnerabilities, fueling criticism of DeFi security. Continue Reading: Aave faces $8.45 billion outflow after $292 million hack The post Aave faces $8.45 billion outflow after $292 million hack appeared first on COINTURK NEWS .
7 Jun 2026, 04:00
AAVE crashes 12% despite buyer demand – A rebound is still possible

AAVE fell 12% despite buyer-dominant activity, while oversold conditions raised rebound hopes.
2 Jun 2026, 14:15
Bitwise Appointed Official Asset Issuer for Aave Horizon

BitcoinWorld Bitwise Appointed Official Asset Issuer for Aave Horizon Aave CEO Stani Kulechov has announced that Bitwise has been named the official asset issuer for Aave Horizon, a new institutional-focused lending platform. Under the agreement, Bitwise will manage the USCC tokenized yield fund, which will be rebranded as the Bitwise Crypto Carry Fund. Strategic Partnership Details The collaboration positions Bitwise as a key infrastructure provider within the Aave ecosystem. The Bitwise Crypto Carry Fund is described as a tokenized vehicle designed to generate returns through a market-neutral, crypto-based strategy. This approach aims to deliver consistent yields while minimizing exposure to directional market movements, appealing to institutional investors seeking predictable returns in the volatile digital asset space. Implications for Institutional DeFi Aave Horizon, launched earlier this year, targets institutional participants by offering permissioned lending pools with enhanced compliance features. The integration of Bitwise’s fund into Horizon signals a growing convergence between traditional asset management and decentralized finance. By tokenizing a yield-generating strategy, Bitwise provides a regulated, transparent vehicle that can be seamlessly integrated into blockchain-based lending protocols. What This Means for Investors For institutional investors, the Bitwise Crypto Carry Fund offers a compliant entry point into DeFi yield generation. The fund’s market-neutral strategy reduces the risk of capital depreciation during market downturns, a key concern for risk-averse participants. Additionally, the tokenization of the fund allows for programmatic interaction with Aave Horizon’s smart contracts, enabling automated lending and borrowing operations. Conclusion The appointment of Bitwise as the official asset issuer for Aave Horizon represents a notable step in bridging traditional finance with decentralized lending. As institutional adoption of DeFi accelerates, partnerships like this highlight the growing demand for regulated, transparent, and efficient yield-generating instruments within blockchain ecosystems. FAQs Q1: What is Aave Horizon? Aave Horizon is an institutional lending platform built on the Aave protocol, offering permissioned pools with compliance features for accredited investors and institutions. Q2: What is the Bitwise Crypto Carry Fund? It is a tokenized fund that generates returns through a market-neutral strategy, aiming to provide consistent yields without relying on directional cryptocurrency price movements. Q3: How does this partnership benefit institutional investors? It provides a regulated, tokenized yield fund that can be directly integrated into Aave Horizon’s lending pools, offering institutions a compliant and efficient way to access DeFi yields. This post Bitwise Appointed Official Asset Issuer for Aave Horizon first appeared on BitcoinWorld .

